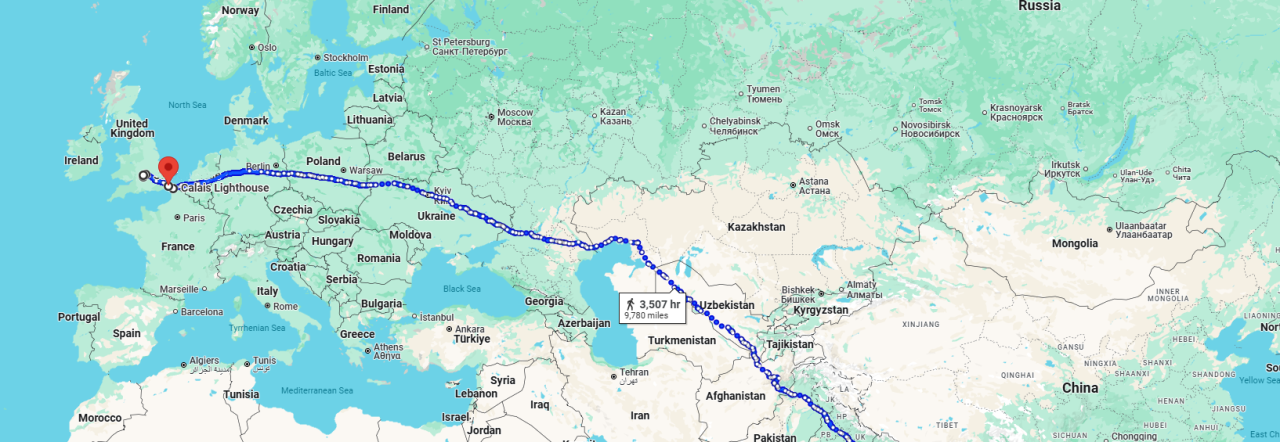
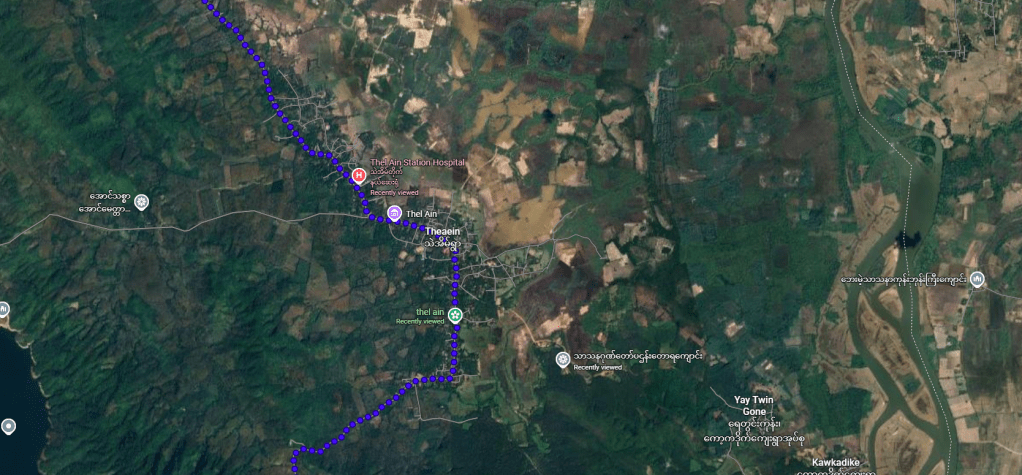
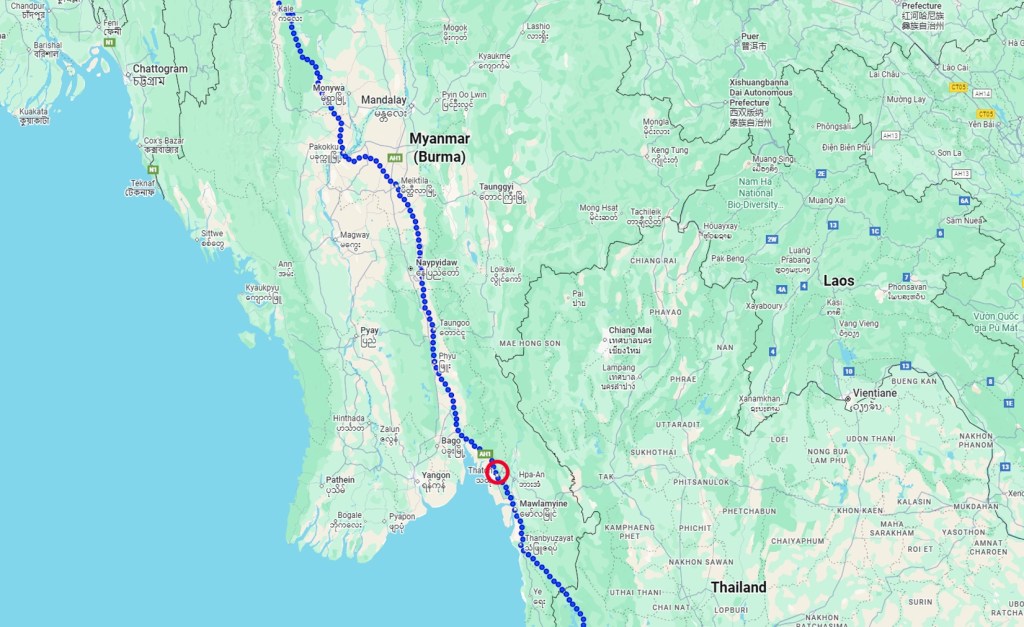
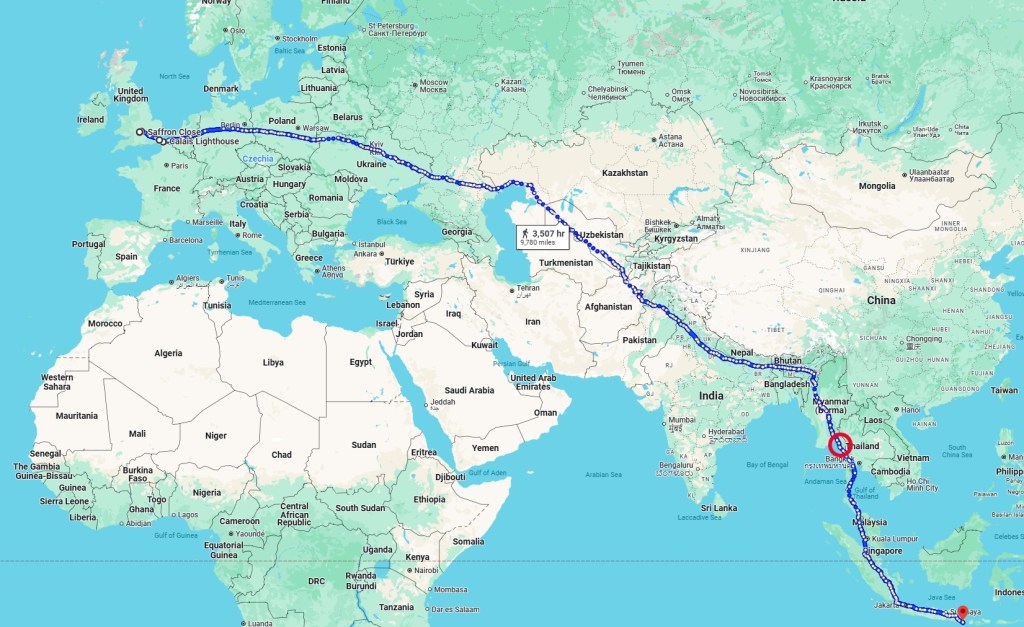
With the last full week of the year behind us we find ourselves in Theaein, Myanmar. Honestly, it’s more temples, more little shops (love a little shop), and more motorbikes. I’m looking forward to reaching Thailand and our first new country in weeks.
Carlin completed here stretch goal this week, so I’m of the hook for getting into trouble. Phew. Well done Carlin.
I decided to ask Microsoft Copilot (you’re welcome, Kev) what insights it could pull from the data. Check out the stats after the maps, they’re fairly interesting/entertaining.
| Lyne Road Running Club | Target | +/- |
| 7505 | 9723 | -2218 |
| Name | Run | Ride | Walk | Total |
| Thomas Adams | 188 | 141 | 42 | 370 |
| Carlin Bowers | 0 | 411 | 83 | 493 |
| David Bowers | 116 | 814 | 160 | 1090 |
| Jonathan Brock | 19 | 0 | 177 | 196 |
| Matt Brock | 396 | 24 | 127 | 558 |
| Kevin Hook | 1279 | 0 | 612 | 1891 |
| Chris Hardy | 1187 | 56 | 0 | 1267 |
| Jay Evans | 217 | 0 | 1422 | 1639 |
| Grand total | 3401 | 1446 | 2623 | 7505 |
| Name | 2025 Goal | Completed | 2025 Remaining | 2025 % Complete | 2025 miles per day required |
| Thomas Adams | 662 | 370 | 292 | 56.0% | 97.17 |
| Carlin Bowers | 500 | 493 | 7 | 98.7% | 2.18 |
| David Bowers | 966 | 1090 | -124 | 112.8% | -41.23 |
| Jonathan Brock | 408 | 196 | 212 | 48.2% | 70.51 |
| Matt Brock | 804 | 558 | 246 | 69.4% | 81.99 |
| Kevin Hook | 1919 | 1891 | 28 | 98.5% | 9.49 |
| Chris Hardy | 1522 | 1267 | 255 | 83.2% | 85.00 |
| Jay Evans | 1300 | 1639 | -339 | 126.1% | -113.09 |
| Grand total | 8081 | 7505 | 576 | 92.9% | 192.03 |
🏆 Team & Challenge Highlights
- Total Miles Logged (All Activities):
7,323.31 miles (as of the latest summary), with a team goal of 8,081 miles for 2025.
→ The team is at 90.6% of the annual goal. - Days Remaining in 2025:
Only 14 days left in the year (as of the latest summary). - Miles Needed per Day (Team):
To hit the goal, the team needs to average 54.12 miles/day for the remainder of the year.
🥇 Individual Standouts
Most Miles Logged (All Activities)
- Kevin Hook:
1,834.57 miles (Run: 1,263.29 | Walk: 571.28 | Ride: 0) - Chris Hardy:
1,248.23 miles (Run: 1,168.09 | Walk: 55.83 | Ride: 0) - Jay Evans:
1,591.23 miles (Run: 216.87 | Walk: 1,374.36 | Ride: 0)
Closest to Goal (2025 % Complete)
- Carlin Bowers:
94% of goal completed (470.05/500 miles) - Kevin Hook:
95.6% of goal completed (1,834.57/1,919 miles) - Chris Hardy:
82% of goal completed (1,248.23/1,522 miles)
Most Over Goal
- Jay Evans:
22.4% over goal (1,591.23/1,300 miles; +291.23 miles)
Largest Remaining Gap
- Jonathan Brock:
212.31 miles left to reach goal (195.69/408 miles; 47.96% complete)
🚴♂️ Activity Type Leaders
- Longest Single Activity (Ride):
Several rides over 10 miles; longest logged is 14.34 miles (Thomas Adams, April 4). - Longest Single Activity (Run):
26.27 miles (Chris Hardy, Newport Marathon, April 13). - Longest Single Activity (Walk):
40 miles (Thomas Adams, Ridgeway walk, July 5).
📈 Consistency & Streaks
- Most Consistent Daily Logger:
Kevin Hook and Chris Hardy have logged activities almost every day, often with both a run and a walk. - Multi-Sport Athletes:
Matt Brock and David Bowers regularly log runs, rides, walks, and weight training.
🏅 Fun & Quirky Stats
- Most International Activities:
Jay Evans logs walks and runs in New Zealand, Australia, and the UK—sometimes on the same week! - Most Weight Training Sessions:
Matt Brock logs frequent weight training, often with creative session names (“Legs after run club is an error 😅”). - Most “School Pickup/Dropoff” Rides:
Carlin Bowers and David Bowers have dozens of short rides labeled as school runs.
📊 Progress Snapshots
- Team is only 757.69 miles from the annual goal.
- Jay Evans has the highest “over goal” mileage.
- Carlin Bowers and Kevin Hook are closest to hitting their personal goals.
- Jonathan Brock and Matt Brock have the most ground to make up to reach their goals.
🏃♂️ Run Lengths
- Shortest Runs:
- There are several runs as short as 0.24 miles (e.g., Jonathan Brock, May 7).
- Many runners log “cool down” or “warm up” runs under 1 mile.
- Typical Run Lengths:
- The majority of runs fall between 3 and 6 miles.
- Common distances: 3.1 miles (5K), 4–5 miles, and 6.2 miles (10K).
- Longest Runs:
- Chris Hardy: 26.27 miles (Newport Marathon, April 13)
- Matt Brock: Multiple half marathons (13.05–13.26 miles)
- Several runners have logged 10+ mile runs, especially in spring and autumn.
⏱️ Pace Insights (Runs Only)
- Fastest Paces:
- Some short runs (1–2 miles) are logged at paces under 7:00/mile (e.g., Matt Brock, sub-20min 5K training, August 17: 1.96 miles at 6:13/mile).
- Kevin Hook and Chris Hardy frequently log runs in the 7:00–8:00/mile range for 3–5 mile distances.
- Typical Paces:
- Most runners average between 8:00–9:30/mile for 3–6 mile runs.
- Longer runs (10+ miles) tend to be in the 9:00–10:30/mile range, reflecting endurance pace.
- Slower Paces:
- Some “run-walk” or recovery runs are logged at 10:00–13:00/mile.
- Marathon and ultra distances (20+ miles) are often in the 9:30–11:00/mile range.
📅 Time-of-Year Patterns
- Winter (Jan–Feb):
- Lower average run distances, more short runs and treadmill sessions.
- Paces are slightly slower, likely due to weather.
- Spring (Mar–May):
- Noticeable increase in both frequency and length of runs.
- Many runners log their longest runs and races (marathons, half marathons).
- Paces improve as weather warms.
- Summer (Jun–Aug):
- Consistent running, but more short runs and some slower paces (heat effect).
- Some runners switch to early morning or evening runs to avoid heat.
- Autumn (Sep–Nov):
- Another peak in long runs and races.
- Many “event” runs (relays, marathons, club runs).
- Paces are strong, often matching or beating spring times.
- December:
- Slight drop in frequency and length, more “maintenance” runs and festive events.
📊 Notable Observations
- Consistency:
- Kevin Hook and Chris Hardy are among the most consistent, running year-round with few gaps.
- Matt Brock and Thomas Adams show strong spring/autumn peaks.
- Event Clustering:
- Marathons and half marathons are clustered in April, May, September, and October.
- Many runners log “race pace” or “event” runs around these months.
- Pace vs. Distance:
- Shorter runs are generally faster; longer runs are slower, as expected.
- Some runners (e.g., Matt Brock, Chris Hardy) maintain strong paces even on longer runs.
Example Stats
- Fastest 5K-equivalent:
- Matt Brock, August 17: 1.96 miles at 6:13/mile (sub-20min 5K pace).
- Longest Run:
- Chris Hardy, April 13: 26.27 miles (Newport Marathon).
- Most Runs in a Month:
- Kevin Hook and Chris Hardy, often logging 15–20 runs per month.
